Student Research | Running a Marathon in 45 Seconds Flat
By Chris Rozolis, Class of 2018
This excerpt is taken from an MSiA student research blog posting. Each month, students in our program submit original extracurricular research as part of our blog competition. The winner(s) are published to the MSiA Student Research Blog, our program website, and receive a chance to attend an analytics conference of their choice. Visit our blog to see more.
Background
Large marathons such as the Bank of America Chicago Marathon have followed an operations plan known as the “Chicago Model” since 2009. This operations plan treats an entire race as a mass casualty event, as the number of medical treatments at course aid stations and medical tents historically reach one to two thousand. This model is used because marathons are resource intensive, but predictable as so because there are expected runner injuries/aid requests. This Chicago Model unifies operations staff in one location on race day with the race organizers (Chicago Event Management), Chicago Police Department, Chicago Fire Department, Department of Homeland Security, American Red Cross, and many other organizations coexisting in one physical place. All represented groups in this Unified Command center have one common question: how is the race progressing?
Runner tracking data necessary information in order to answer one simple question for every mile segment of the Chicago Marathon: how many runners are in this segment right now? While the answer to this question can help many different stakeholders within the Unified Command center, the answer is also needed in the event of an emergency. Should anything occur on race day that would trigger emergency responses, the “Chicago Model” may dictate runners shelter in place or move to shelter locations. This requires accurate estimates of the number of runners present at each mile segment at any given minute for the correct resources to be dispatched proportionally in the event of an emergency.
One might think the Data Visualization System (DVS) could simply display real-time numbers of actual runners and map them to their correct mile segments. Well…this is where things get tricky.

The Problem
Runner tracking feeds can be inconsistent. The marathon tracking mats that determine runner results and track how fast runner splits are between each 5K markers are fantastic pieces of technology, however, they are best used for post-race results. During the race the mat-tracked numbers are manually adjusted for various reasons. Additionally, these mat-tracked runner numbers are split by 5K distances instead of by mile marker. Information at the mile-level is a necessity for contingency planning. Using these feeds real-time does not enable the granular level of information needed for emergency planning and preparedness.
The Solution
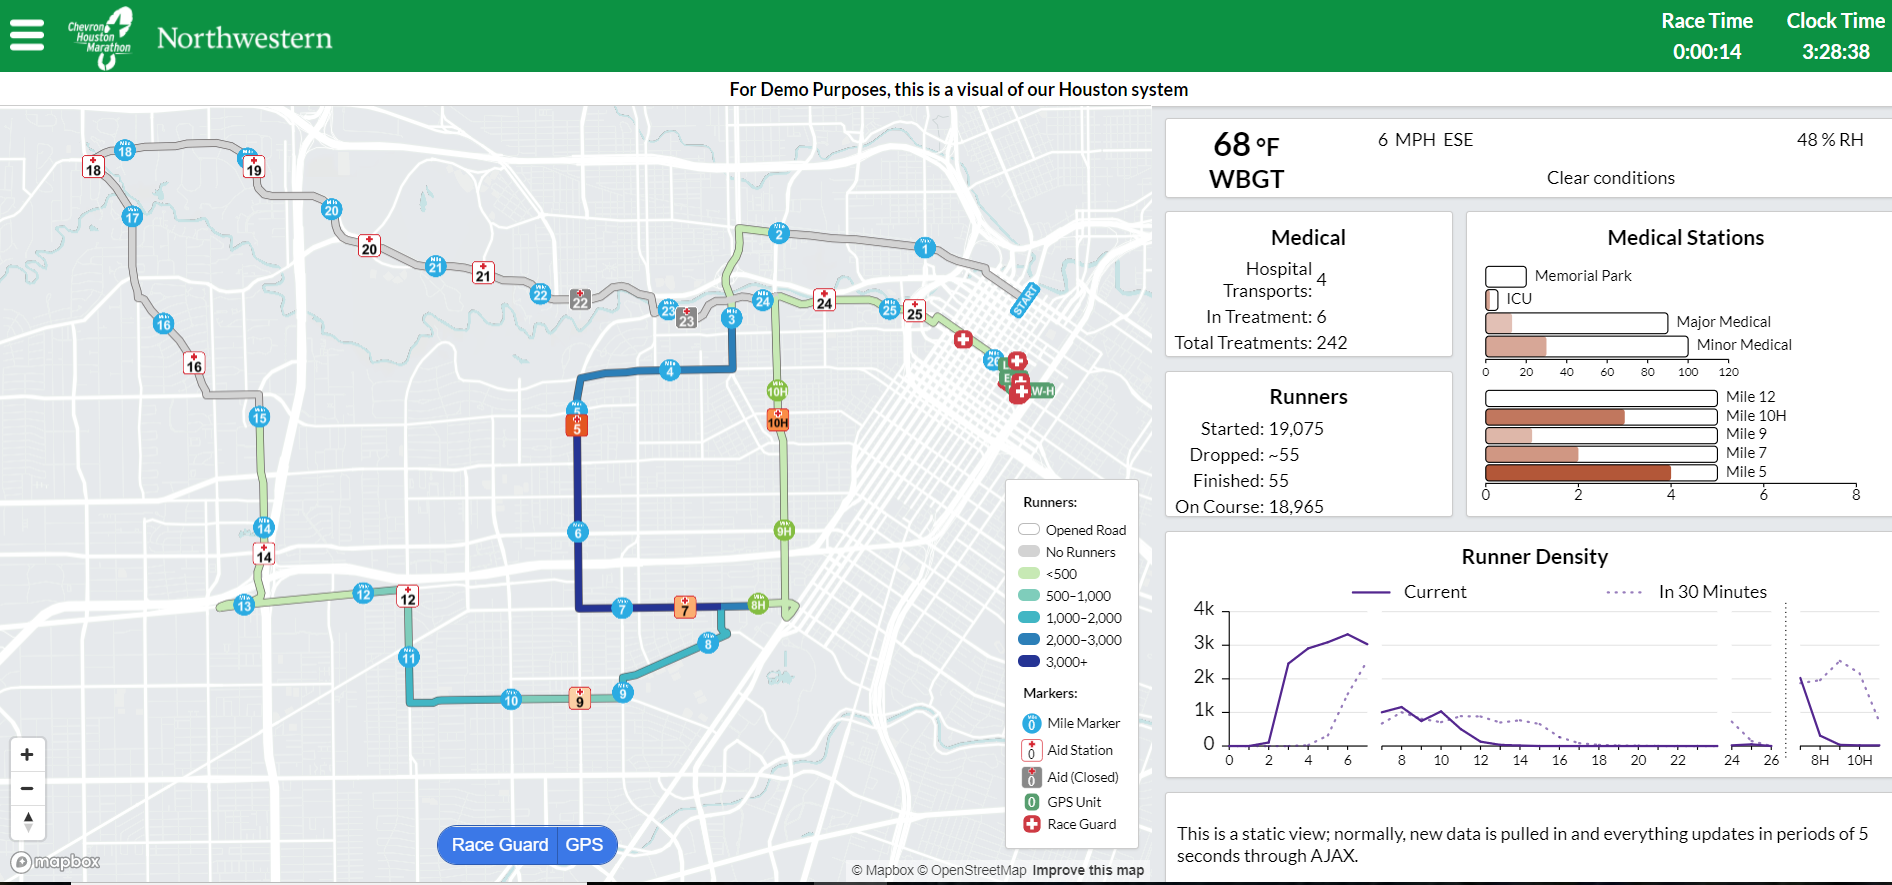
Due to real-time data issues, the original DVS team decided to build a marathon simulation. The idea is simple: create a bunch of Python objects to represent a group of runners and have them “run” a marathon. Over the past five years, the simulation has steadily improved. Initially the simulated runners had distances logged every 10 minutes of their race, meaning the simulation could give runner density counts in ten minute intervals within the Unified Command center. Later iterations updated runner speed estimates from interpolation to piecewise regression models. Estimates narrowed down to the 2 minute level, but still left room for improvement to predict better numbers for contingency planning.
Today, I can simulate every single minute of the Chicago Marathon at every mile marker, and can map 10,000 simulated runners to 46,000 real marathon runners. This allows the DVS team to achieve the desired level of granularity needed for accurate runner locations and emergency preparedness. This recent iteration is the result of a major overhaul I implemented that now accounts for a large portion of the predictive and prescriptive power the DVS system has to assist marathon organizers.

