McCormick Does Well in New NRC Rankings
The National Research Council (NRC) rankings of Research-Doctorate Programs in the United States -- regarded by many people in academia as the most in-depth analysis of PhD programs -- were announced on September 28, 2010. The NRC is the research arm of the National Academies, which include the National Academy of Science, the National Academy of Engineering, and the Institute of Medicine. Its mission is to provide elected leaders, policy makers, and the public with expert advice based on sound scientific evidence. One function of the NRC is to assess the health of doctoral programs approximately every ten years, and then to develop and disseminate a ranking of these programs.
The McCormick School of Engineering and Applied Science has done quite well. However, there are a few factors to consider when viewing the ranking information. The data collection for these rankings began in June of 2006. A number of institutions have changed significantly in the last four years. Many were affected in hiring patterns by the recent economic crisis. Others slowed down hiring or even stopped altogether. And few others hired aggressively. Taking these factors into account is tricky. Moreover, the methodology followed is quite involved, and the interpretation of various results is far from straightforward. A summary of the steps in the NRC ranking methodology is given below.
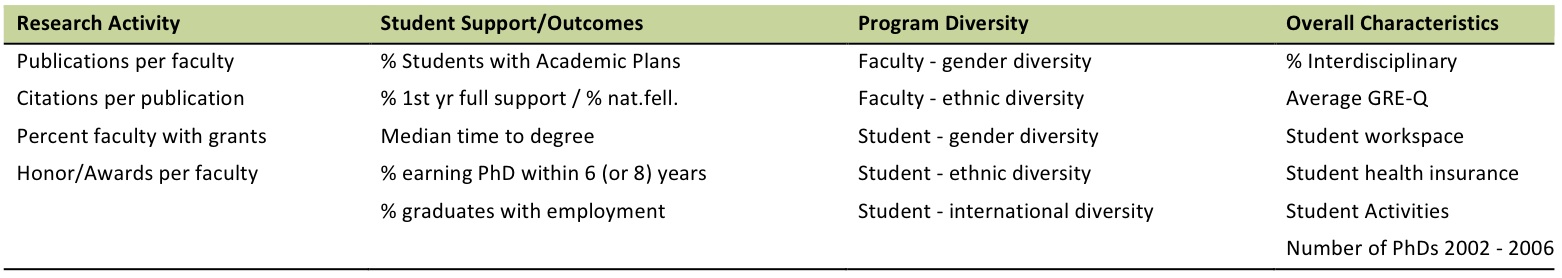
- Data Collection: NRC collected data from institutions, faculty, and external sources such as ISI Web of Science. There were 21 variables divided into four categories: (i) Research Activity (RA), (ii) Student Support & Outcomes (SS), (iii) Diversity (D), and (iv) Other Measures. The variables are listed inTable 1. For overall ranking, 20 of these 21 variables were used (the number of student publications and presentations was omitted because of lack of reliable data). The data on all the variables were standardized for all programs within each field so that their mean was 0 and standard deviation was 1. Thus each variable is unitless, and its measurement scale and its magnitude do not matter.
-
Determination of Direct or Survey Weights (S weights): A sample of faculty were asked to assign weights to the variables. The weights were specific to the field and were obtained by averaging the weights assigned by all the sampled faculty in that particular field. Each sampled faculty was asked to select the four most important variables; next they were asked to select the two more important ones from those four. The two more important variables were assigned a score of 2, while the other two were assigned a score of 1. The 20 variables were divided into three groups: (i) faculty variables, (ii) student variables, and (iii) program variables. The faculty were also asked to assign a relative weight to each of the three groups, e.g., 0.3, 0.2, and 0.5. The scores of the four selected variables were multiplied by the weights assigned to their corresponding groups to arrive at the final weights for that particular faculty. The weights were averaged over all faculty and were normalized to add up to 1.
-
Determination of Indirect or Regression Weights (R weights): The same sample of faculty were asked to rate, on a scale of 1 to 6, a sample of programs (typically 15) in their fields. Then a regression analysis was done to determine the best regression model, using the reputational rating as the dependent variable and the 20 variables as independent variables. The regression coefficients, appropriately standardized, were used as indirect or implicitly determined weights. More details are available from the TGS website.
-
Resampling of Data to Calculate Distributions of R and S Ranks: The data used in the calculation of ranks were subject to random variability arising from many different sources, e.g., faculty were randomly selected and the programs that they ranked on reputation were also randomly selected. There were random errors in the way faculty assigned weights and scores. Furthermore, there were random errors in program variables such as the numbers of publications and citations obtained from ISI. To account for all these sources of random errors, NRC adopted simulation methodology. Basically, NRC generated 500 random data sets from the original data set for each discipline. The program variables for each of the 500 data sets were randomly generated by using assumed or estimated variances.The faculty response data were generated by drawing random 50% samples from the actual faculty responses ("random halves method"). All the weights and scores were recalculated for each of the 500 data sets, resulting in 500 sets of ranks for each academic program. The top 5th percentile and the bottom 5th percentile of the ranks (i.e., 25th and 475th ranks) are reported.
-
Interpretation: For each program, five sets of rankings are reported: two overall rankings (R-ranking and S-ranking) and three so-called dimensional rankings (RA-ranking, SS-ranking, and D-ranking). For the overall rankings, data on 20 of the 21 variables were utilized, while for the dimensional rankings only the data for their associated variables were used.
As an example, consider the MSE Department. Its R-ranking is between 3 and 9, and its S-ranking is between 3 and 15, both with 90% confidence. To take into account the number of programs ranked in each discipline, relative ranks were obtained by dividing the absolute ranks by the number of programs in material science, which was 83. Thus the relative R-ranks are between 4% and 11% and the relative S-ranks are between 4% and 18%. One can interpret this as follows: with 90% confidence, the MSE Department is ranked as high as the 4th percentile in both R- and S-rankings. Similarly, one could interpret the lower limit as follows: with 90% confidence, the MSE department's R-ranking is not lower than 11th percentile.