Data as Art Showcases Collaborative Projects
Projects are based on data from Chicago transportation, crime, genetics, and soil contamination
 Synbiodome
 Soiled
 The Moving Class
 Addgene Quest
 312
312For the third year in a row, artists and engineers have teamed up in Data as Art, a collaborative class between Northwestern Engineering and the School of the Art Institute of Chicago (SAIC).
Taught in the fall, Data as Art brings together students from both institutions to fuse analytics and aesthetics by representing data sets through visual arts. Final projects are now on display in the atrium of the Ford Motor Company Engineering Design Center until February 19.
Bruce Ankenman, co-director of the Segal Design Institute who leads the class on Northwestern’s end, said the overarching objective is to have artists and engineers work together, sharing thought patterns, cultures, and work styles.
“There’s the technological piece about manipulating data, but it’s also natural that data can have some sort of message or display,” he said. With students from both schools on each team, Data as Art mirrors Northwestern Engineering’s emphasis on multidimensionality.
“We were able to utilize various talents of people from different backgrounds, which helped bring new perspectives to the challenge,” said Seph Lang, a Northwestern Engineering graduate student.
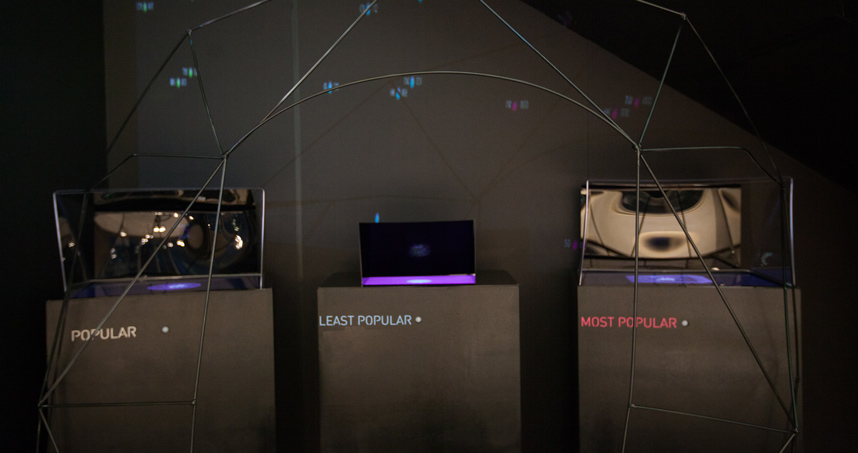
Lang and his teammates examined data sets from the City of Chicago’s data portal to cross analyze Chicago public transit data with the socioeconomic distribution of the city’s population.
The team created three hanging boxes representing different socioeconomic statuses. Each box contained four sheets of laser-etched acrylic: one showed Chicago’s grid system and the other three plotted respective transit data from Chicago Transit Authority buses, trains, and Divvy bikes.
Etched dots represented bike and train usage, and lines represented buses. The largeness of the dot or thickness of the line denoted the volume of transit usage on the map. The team then used various colored LED lights to illuminate the acrylic, highlighting the socioeconomic distribution of transit use in the city.
“Being able to quantify the environment around me and visually represent it in a way that is both engaging and informative is not something you have the opportunity to do very often,” Lang said.
Other student groups focused on the Addgene data set, which describes a nonprofit repository of biological “parts” that was created as part of the open-source biological science movement. The datasets were selected by Northwestern Engineering professors Josh Leonard and Amanda Stathopoulos, who also acted as mentors throughout the class.
Tackling complex data sets was the first challenge in the course, but it didn't prove to be the only one. Students were also faced with navigating how to work with peers from varying backgrounds.
“Working with people from other disciplines is often tough, but I think it’s important to be patient and recognize that everyone has a different way of doing things,” said Jon Tackie, a Northwestern Engineering graduate student.
While difficult at times, the cross-discipline exposure is ultimately beneficial for the students, Ankenman said.
“There’s a lot of melding and readjustment that happens,” he said. “Just seeing how a different group of highly talented, but very differently skilled people works really does make a big difference in the work produced.”
Read more about the final projects:
The Moving Class
Transportation often has significant equity impacts where benefits and costs are unequally distributed in time and space. This project uses City of Chicago portal data to visualize the movements of different socioeconomic statuses and their transportation methods within the city. It allows the audience to examine various facets of mobility fairness and various ways to categorize mobility classes in accessing the city.
312
312 interprets publically available city datasets on crime, education, and income into soundscapes and visualization. The project reveals surprising insights and knowledge about Chicago neighborhoods to the audience.
Synbiodome
This project represents the complex and seemingly chaotic nature of the information contained within the Addgene database. The Synbiodome is activated by participants’ movements through a 3-D space, enabling them to engage and interact with the data through various visual representations. The experience is designed to give non-experts intuitive impressions about the interconnectivity and international landscape associated with this emerging area of scientific research.
Addgene Quest
This project places you in the shoes of a scientist working at the frontier of 21st-century bioscience research. By pairing an interactive game with visualizations derived from the Addgene database, participants will experience trials, tribulations, historical trends, and scientific impact projected through the lens of this unique dataset.
Soiled
Evidence of Chicago’s urban narrative persists in the form of hazardous contaminated soil buried in an industrial past. Soiled examines data that describes the location and level of soil contamination throughout Greater Chicago superfund sites and visualizes the information in a cartographic and consumer context. Along with found objects from these former industrial sites, the data is used to inform the crafting of jewelry and other small objects that prompt critical thinking about the nature of industrial waste materials on a personal scale.